Introduction to Prometheus Metrics and Grafana
Prometheus and Grafana are two popular open-source tools that work together to monitor and visualize system metrics, enabling DevOps teams to keep track of infrastructure performance, troubleshoot issues, and improve system reliability.
Prometheus scrapes and stores time-series data, and Grafana reads this data to create dashboards. Together, they offer a complete monitoring and observability solution:
- Metrics Collection: Prometheus scrapes metrics from target endpoints.
- Data Storage: Prometheus stores these metrics in a time-series database.
- Visualization: Grafana pulls the data from Prometheus and visualizes it in dashboards.
- Alerting: Alerts can be set both in Prometheus and Grafana to notify teams when performance thresholds are breached.
Exposing Metrics for Prometheus
Prometheus uses a specific plain-text format to expose metrics, making it easy for Prometheus to scrape and ingest data from different sources. This format is designed to be efficient, human-readable, and structured, allowing Prometheus to collect data and analyse it via queries.
Each line in the Prometheus metrics output represents either a metric value or metadata about the metric (such as help text or type).
# HELP http_requests_total The total number of HTTP requests.
# TYPE http_requests_total counter
http_requests_total{method="GET", status="200"} 1027
http_requests_total{method="GET", status="500"} 3
In this example:
- The metric name is
http_requests_total, indicating the total number of HTTP requests. - It is of type counter
- There are two sets of labels: one for
method="GET"andstatus="200", and another formethod="GET"andstatus="500". - The values (1027 and 3) represent the number of successful and failed requests, respectively.
Metrics are exposed as HTTP GET endpoint, e.g. GET /metrics
Prometheus metrics from SAP ABAP system
As mentioned above, to get Prometheus metric from SAP we need to create a HTTP-Endpoint which will be called by Prometheus to scrape current values of the metric and, of course, metrics’ values must be calculated.
What will we build
We will develop
- a framework which allows us to define metrics
- ICF Endpoint to expose defined metrics in Prometheus (OpenMetrics) format.

Customizing
To define the metrics, we will create a customisation table ZJKT_METRIC_CUS.
| Fieldname | Description |
|---|---|
| metric | Internal code of the metric |
| name | Name of the metric which will be exposed |
| met_type | Type of the metric: counter, gauge* |
| prov_type | Provider type: CDS-View or Class |
| prov_name | Name of the provider CDS-View or Class |
| description | Text that will be shown after #HELP token |
| active | Flag, if metric is active |
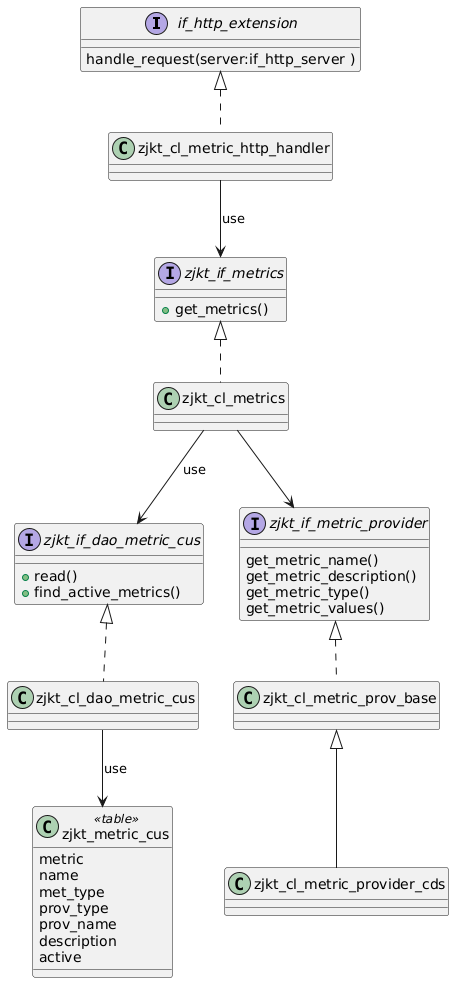
In order to centralize access to the table, we create alse Data Access Object Class (DAO-Class) and it’s factory.
Metric providers
For each metric we want to make available, a provider must be defined to prepare the data. This can be implemented in two ways: as a CDS-View or as an ABAP Class.
The CDS-View must be built in such a way that the names of the output fields correspond to the label names and the values of these fields correspond to the label values. The field named ‘value’ must return the value of the metric for the given label combination.
define view entity zjkt_metr_book_cnt as select from sbook
{
    key carrid as carrier,
    count( * ) as value
} group by carrid
Class ZJKT_CL_METRIC_PROVIDER_CDS executes corresponding CDS-View and returns values of the metric.
When calculation of the metric values can’t be implemented as CDS-View it can developed as ABAP Class. This class must implement interface ZJKT_IF_METRIC_PROVIDER. This interface defines four methods:
get_metric_name – returns external name of the metric
get_metric_description – returns description, which will be showed after #HELP token
get_metric_type – returns metric type
get_metric_values – returns values of the metric for all combinations of labels.
Common implementation of first three methods has been developed in the abstract class ZJKT_CL_METRIC_PROV_BASE which can be used as a base class.
Implementation class
In the class ZJKT_CL_METRICS we will create method get_metrics, that implements logic to calculate values of all active metrics. In first step we look for all active metrics in our customizing table and instantiate provider classes for them. In case of metrics based on CDS-Views the class ZJKT_CL_METRIC_PROVIDER_CDS will be instantiated. After that all methods of each class will be called and results will be collected in the returning parameter.
HTTP Endpoint
In order to expose the metrics as HTTP endpoint we develop handler class ZJKT_CL_METRIC_HTTP_HANDLER. This class implements interface IF_HTTP_EXTENSION. In the method handle_request we call our implementation class to calculate all metrics and then convert results to string representing metric output format.
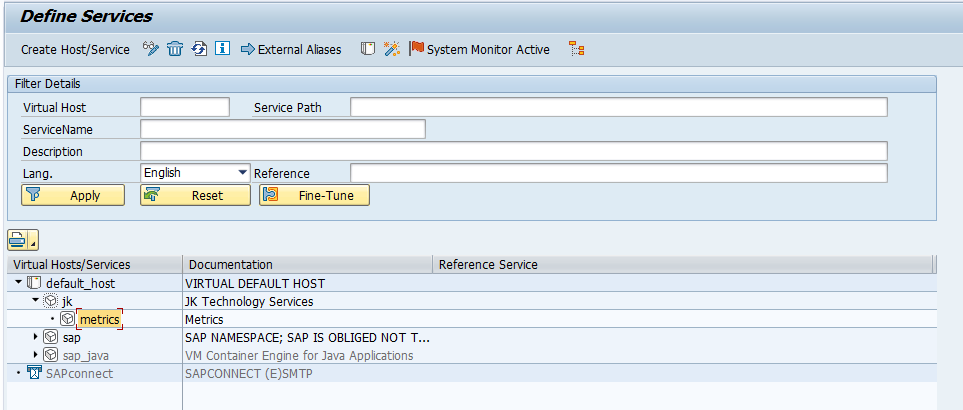
Finally we expose calculated metric as HTTP endpoint. For that purpose, in the trasaction SICF we create new service:

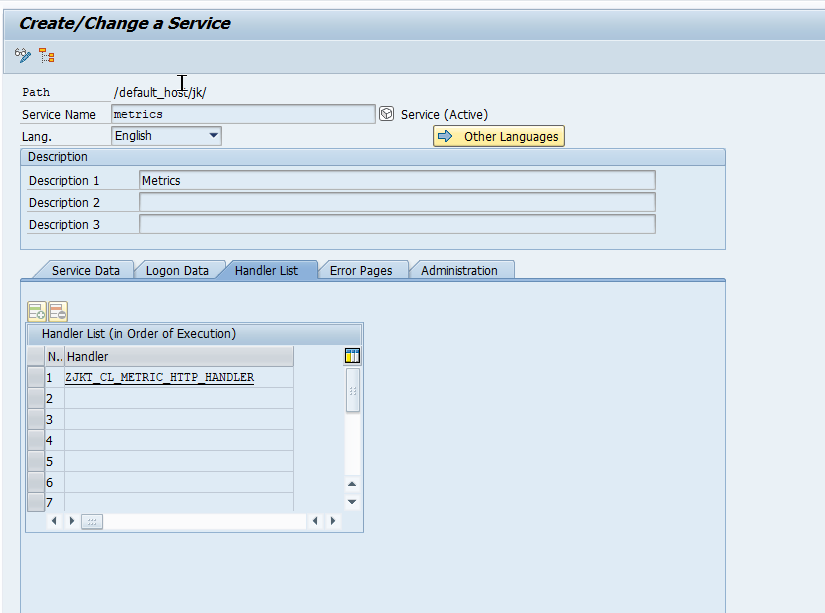
and add our handler class to a handler list

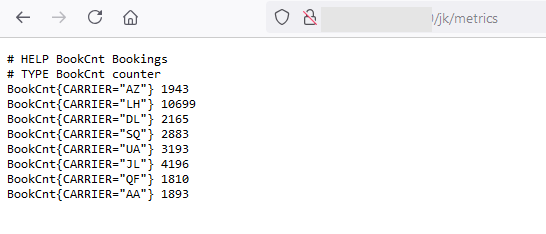
After activation of the created ICF-Service we can call it and see our results.
In the browser enter simply URL https://<sap_host>:<sap_port>/jk/metrics and enter username and password when requested. You will get then our sample metric defined via CDS-View

Complete source code can be found on GitHub.
